Solar project
sunscreenglow is a solar-powered website: you only get access to the content on the website if the connected solar panel is receiving enough light to power it.
Under a (wildly overpowered) solar simulator, it recaptures a small fraction of the energy, spends it on uploading a measurement of that energy to a server, then an energy-intensive website pulls that measurement using a collection of servers, before running JavaScript to continue downloading its current state and shine an animated display visualizing the measurements.
Open simulated web app → Source code on GitHub →Photovoltaics
The start of sunscreenglow is powered by this Voltaic panel:
- 112mm ⨉ 136mm
- Specified maximum abilities:
- OCV: 8.51V
- Short circuit current: 0.36 amps
- Wattage: 2.37W
- Measured abilities under sun simulator, providing 1114 W/m²:
- OCV: 7.14V
- Short circuit current: 0.208 amps
- Estimated wattage (80% of OCV ⨉ SCC): 1.485W
- Measured wattage under IMA studio floor ceiling light: 206 W/m²
Computation
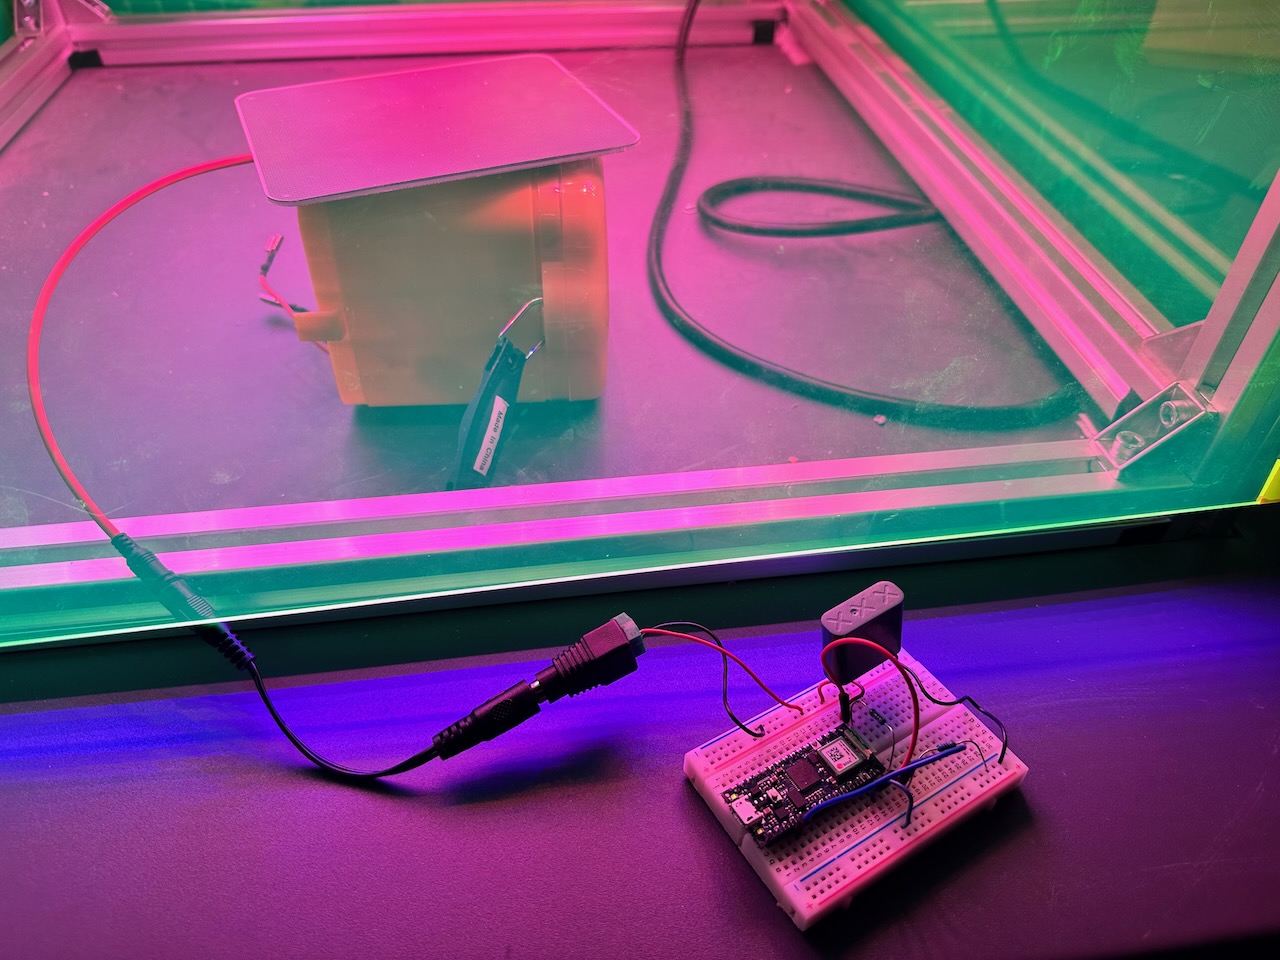
An Arduino Nano 33 IoT connects to my iPhone hotspot’s Wi-Fi network to upload a measurement of voltage received from the solar panel to Adafruit IO, using IO’s official client library.
A website serves as the interface, built with:
- TypeScript, React.js/Next.js
- Styled with Tailwind CSS
- SWR for data fetching
react-animate-number-tickerfor number animations- Deployed on Vercel
When the sun isn’t shining on the solar panel, the website begins with a black screen displaying purely the status, e.g. “Last online 4 days ago.” Once the solar panel is lit up, the capacitor starts charging, the Arduino boots, connects to Wi-Fi, starts uploading data, then the website pulls in a new voltage number. These steps take only a few seconds to complete. The website illuminates itself with an animation, revealing the current voltage and links to my other solar projects.
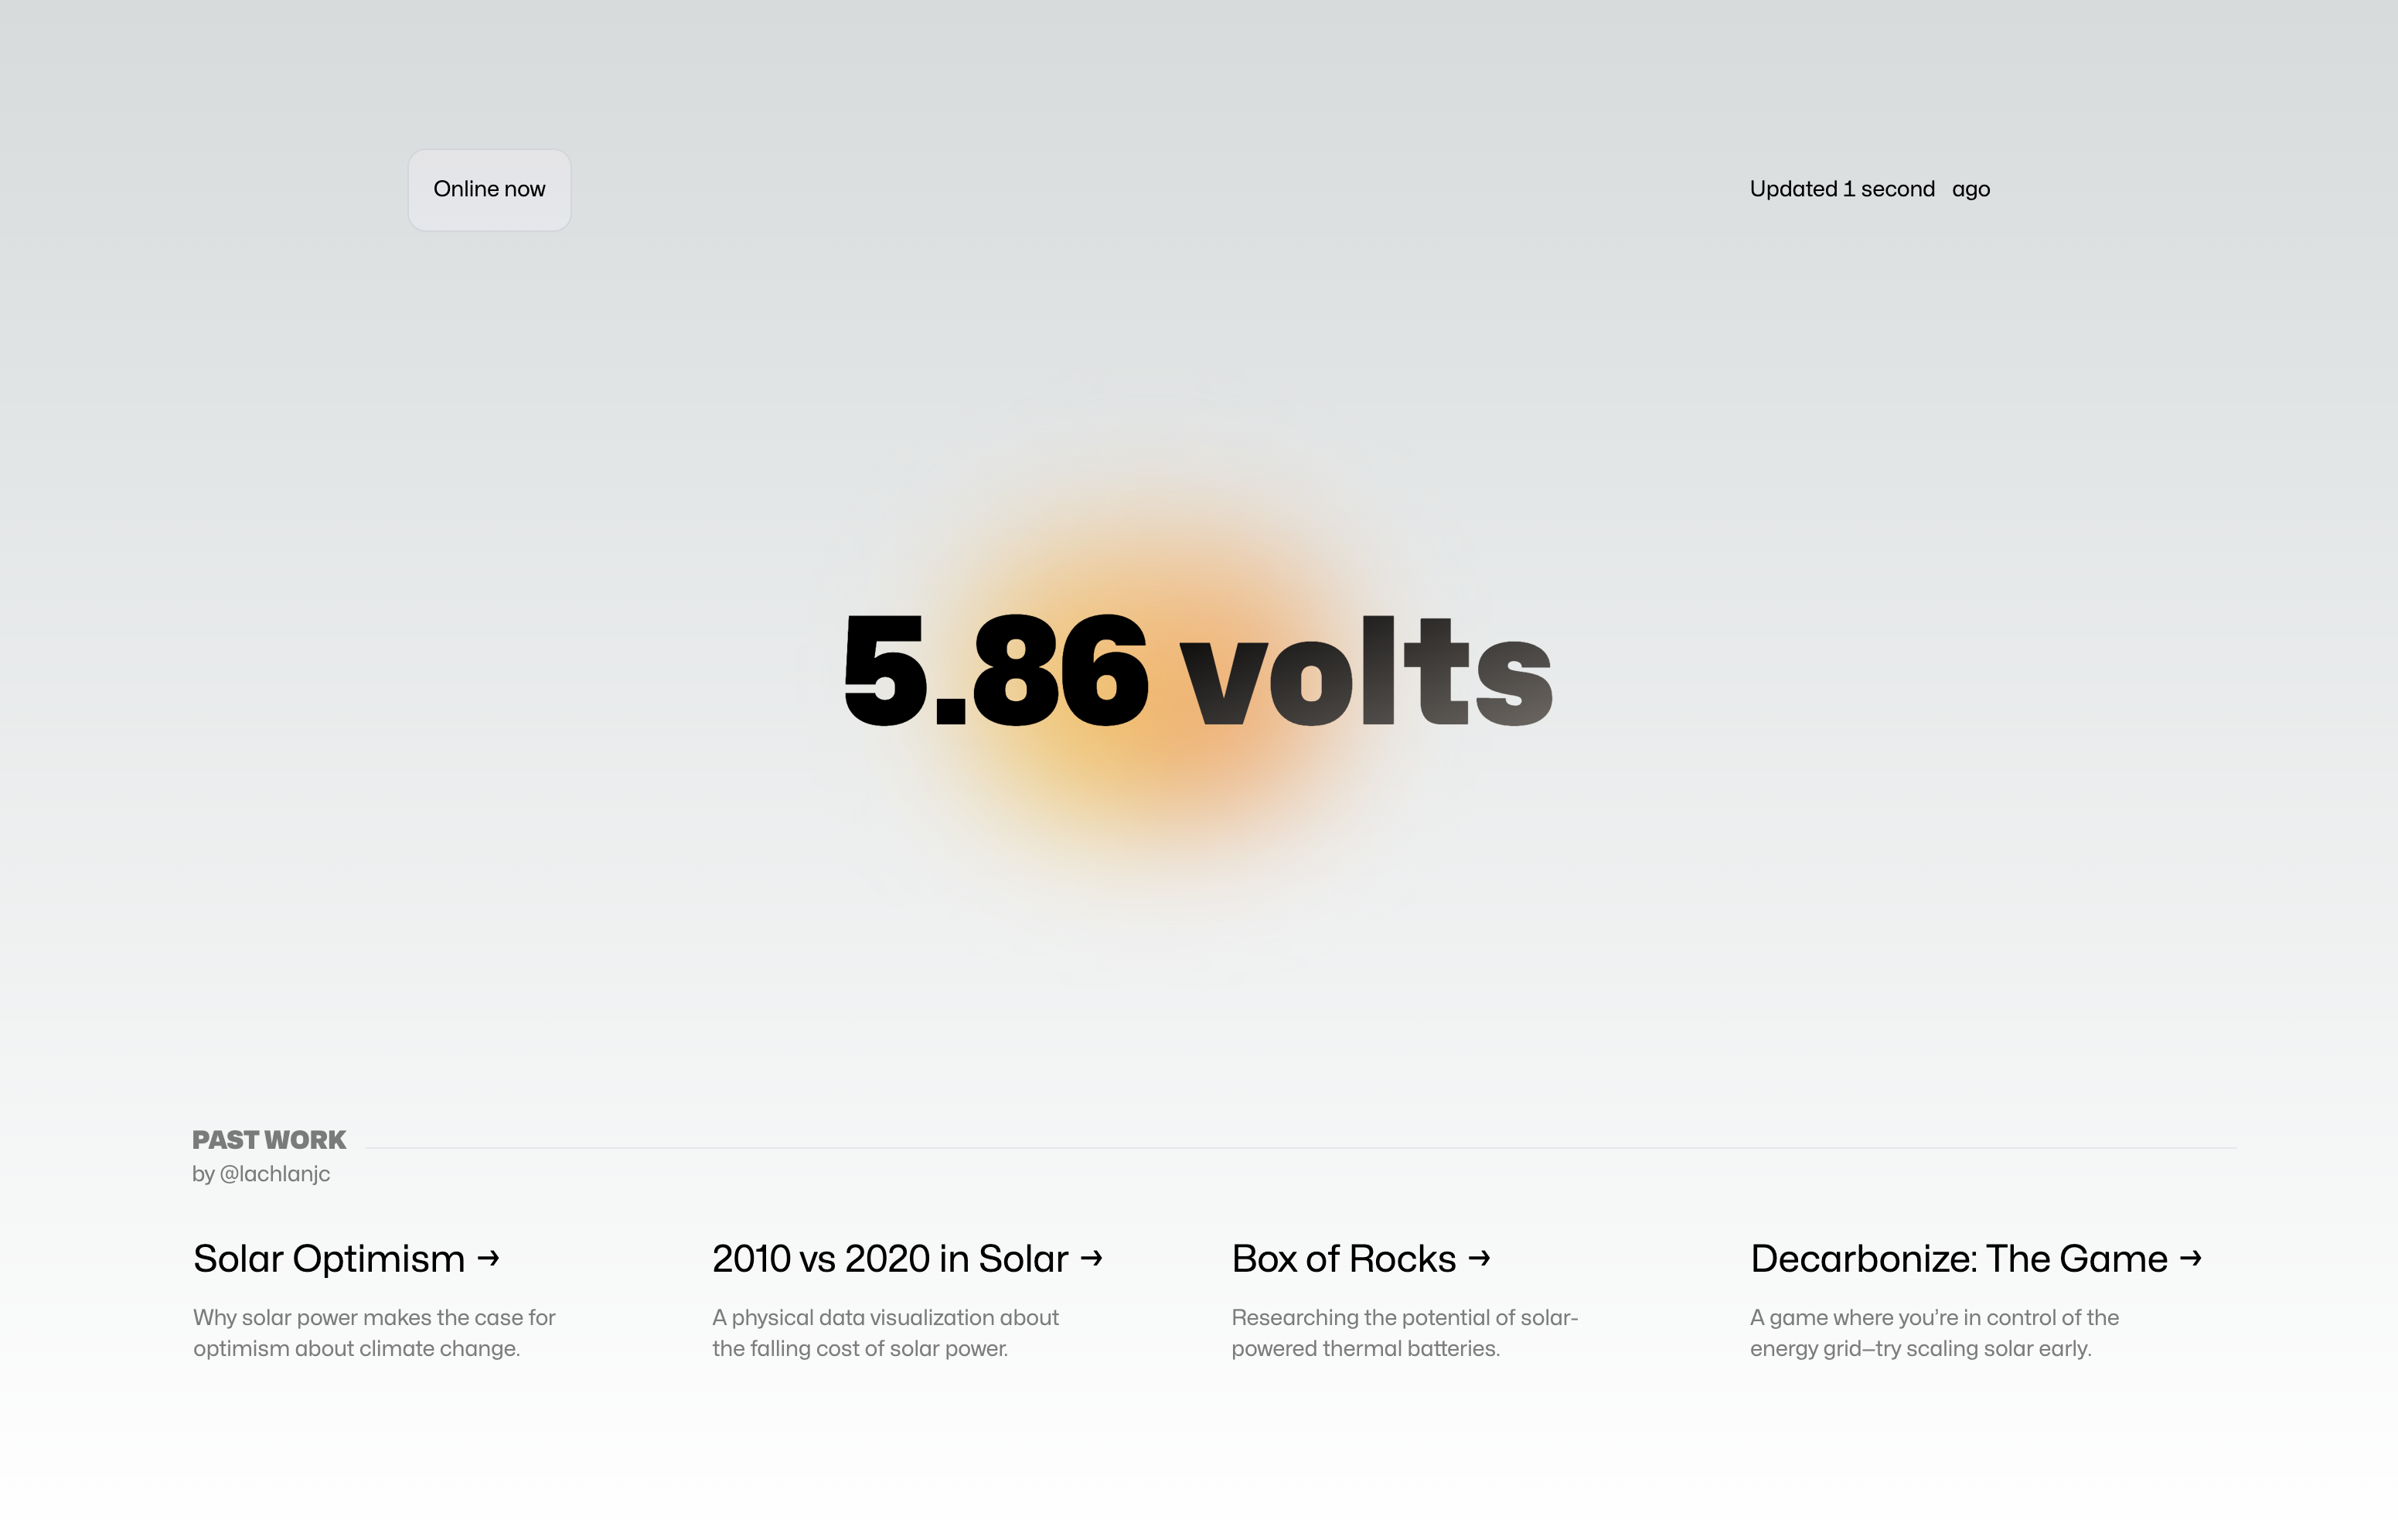
The voltage measured by the Arduino is formatted as an integer from 0-1023. It’s reconverted to its original voltage (with medium precision) on the website itself, by dividing by 1023 to get the percentage of maximum, multiplying by the 3.3V to get the possible voltage input, then by 2 for the voltage divider. This functionality lives inside this React component:
const decimals = new Intl.NumberFormat("en-US", {minimumFractionDigits: 2,maximumFractionDigits: 2,});function Capacity({ latest }: { latest: string }) {const volts = (Number(latest) / 1023) * 3.3 * 2;return <AnimatedNumbers number={Number(decimals.format(volts))} />;}
The design has a few special touches:
- I use tabular numbers for the changing numbers to ensure layout stability.
- The measurement-downloading pauses if you leave the tab, then redownloads when you return to the site, to save energy.
- The animated gradients (inspired vaguely by the top of Apple’s HomePod) are pure CSS.
- CSS transitions animate the transition from Tailwind’s dark mode to light mode.
Since the site requires my physical hardware and auth keys, I’ve created a secondary page of the site that generates fake data every few seconds to show off the interface. Open the simulation here.
Power
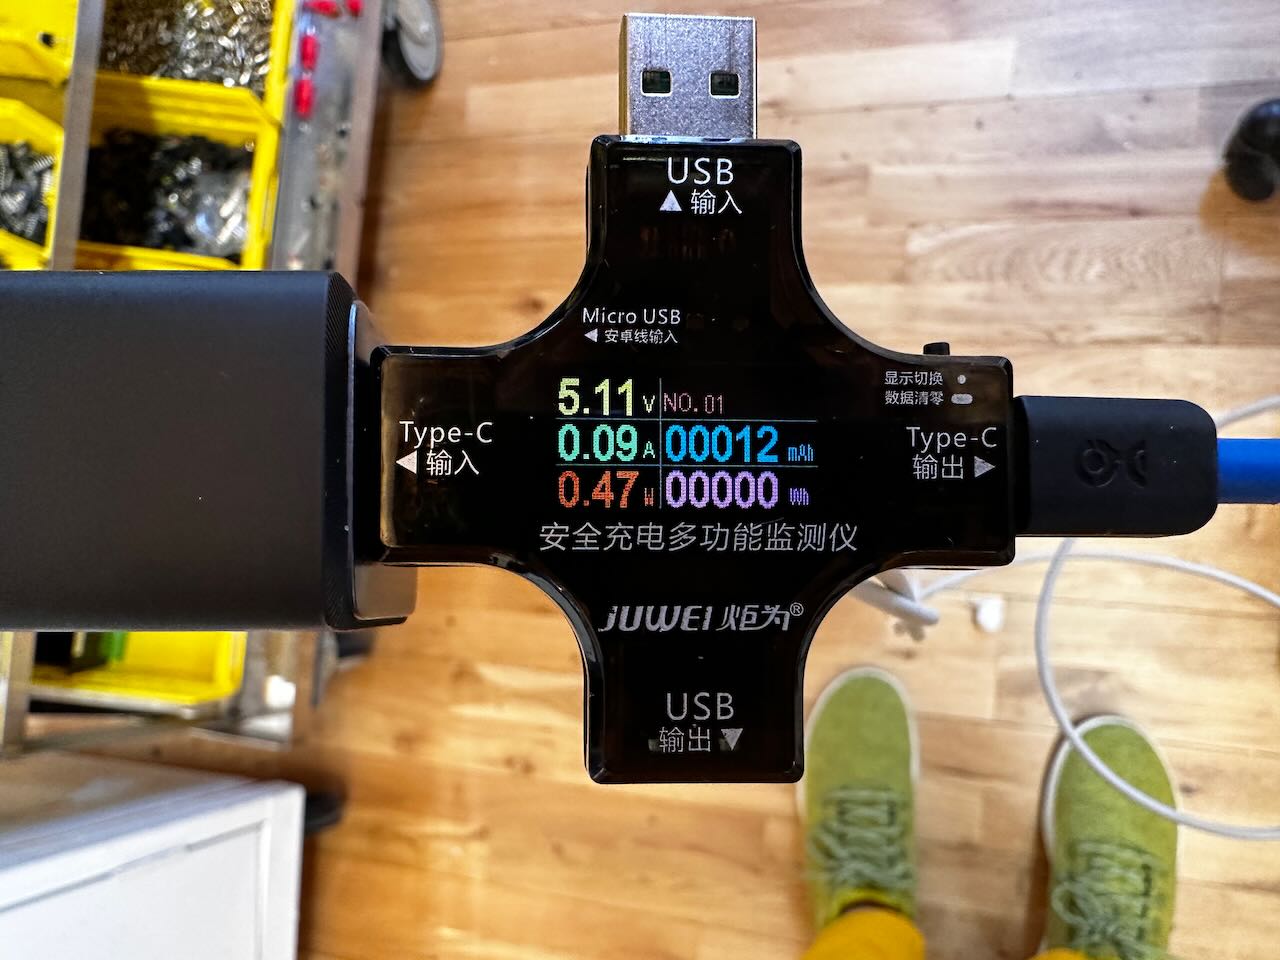
The project requires 5.11 volts, and between 0.05 and 0.09 amps, depending on the part of the program running (booting, connecting to Wi-Fi, delay between uploads, uploading). I measured this using a USB power source and the JUWEI USB power meter.
Energy
The project stores energy in a 9V KYOCERA AVX SuperCapacitor (pg 5) in its circuit, which helps the microcontroller not drop offline when fluctuations in its solar power supply occur. After 60 seconds of receiving little-to-no input power, the Arduino shuts off. Upon the power supply being restored, there’s a delay from both the capacitor recharging and the Arduino reconnecting to Wi-Fi before it’s able to resume uploading voltage values.
This energy storage is not designed to be long-term. It’s an integral part of the design that the physical pieces require enough sunshine to upload for the website to be available; anything more than preventing quick brown-outs would defeat the purpose of the project.
The project remains novel over the course of a few minutes of plugging it in, connecting, watching the website come to life and animate. After a few mins of staring at it and unplugging it, watching it die back down after a simulated delay to make the interaction more symmetrical, there’s not much else to see. Over 3 minutes:
- 0.07 amps ⨉ 5.11 volts = 0.3577 Watts
- 1 hour / 3 minutes = 0.05
- 0.05 hours ⨉ 0.3577 Watts = 0.017885 Watt-hours used
System diagram
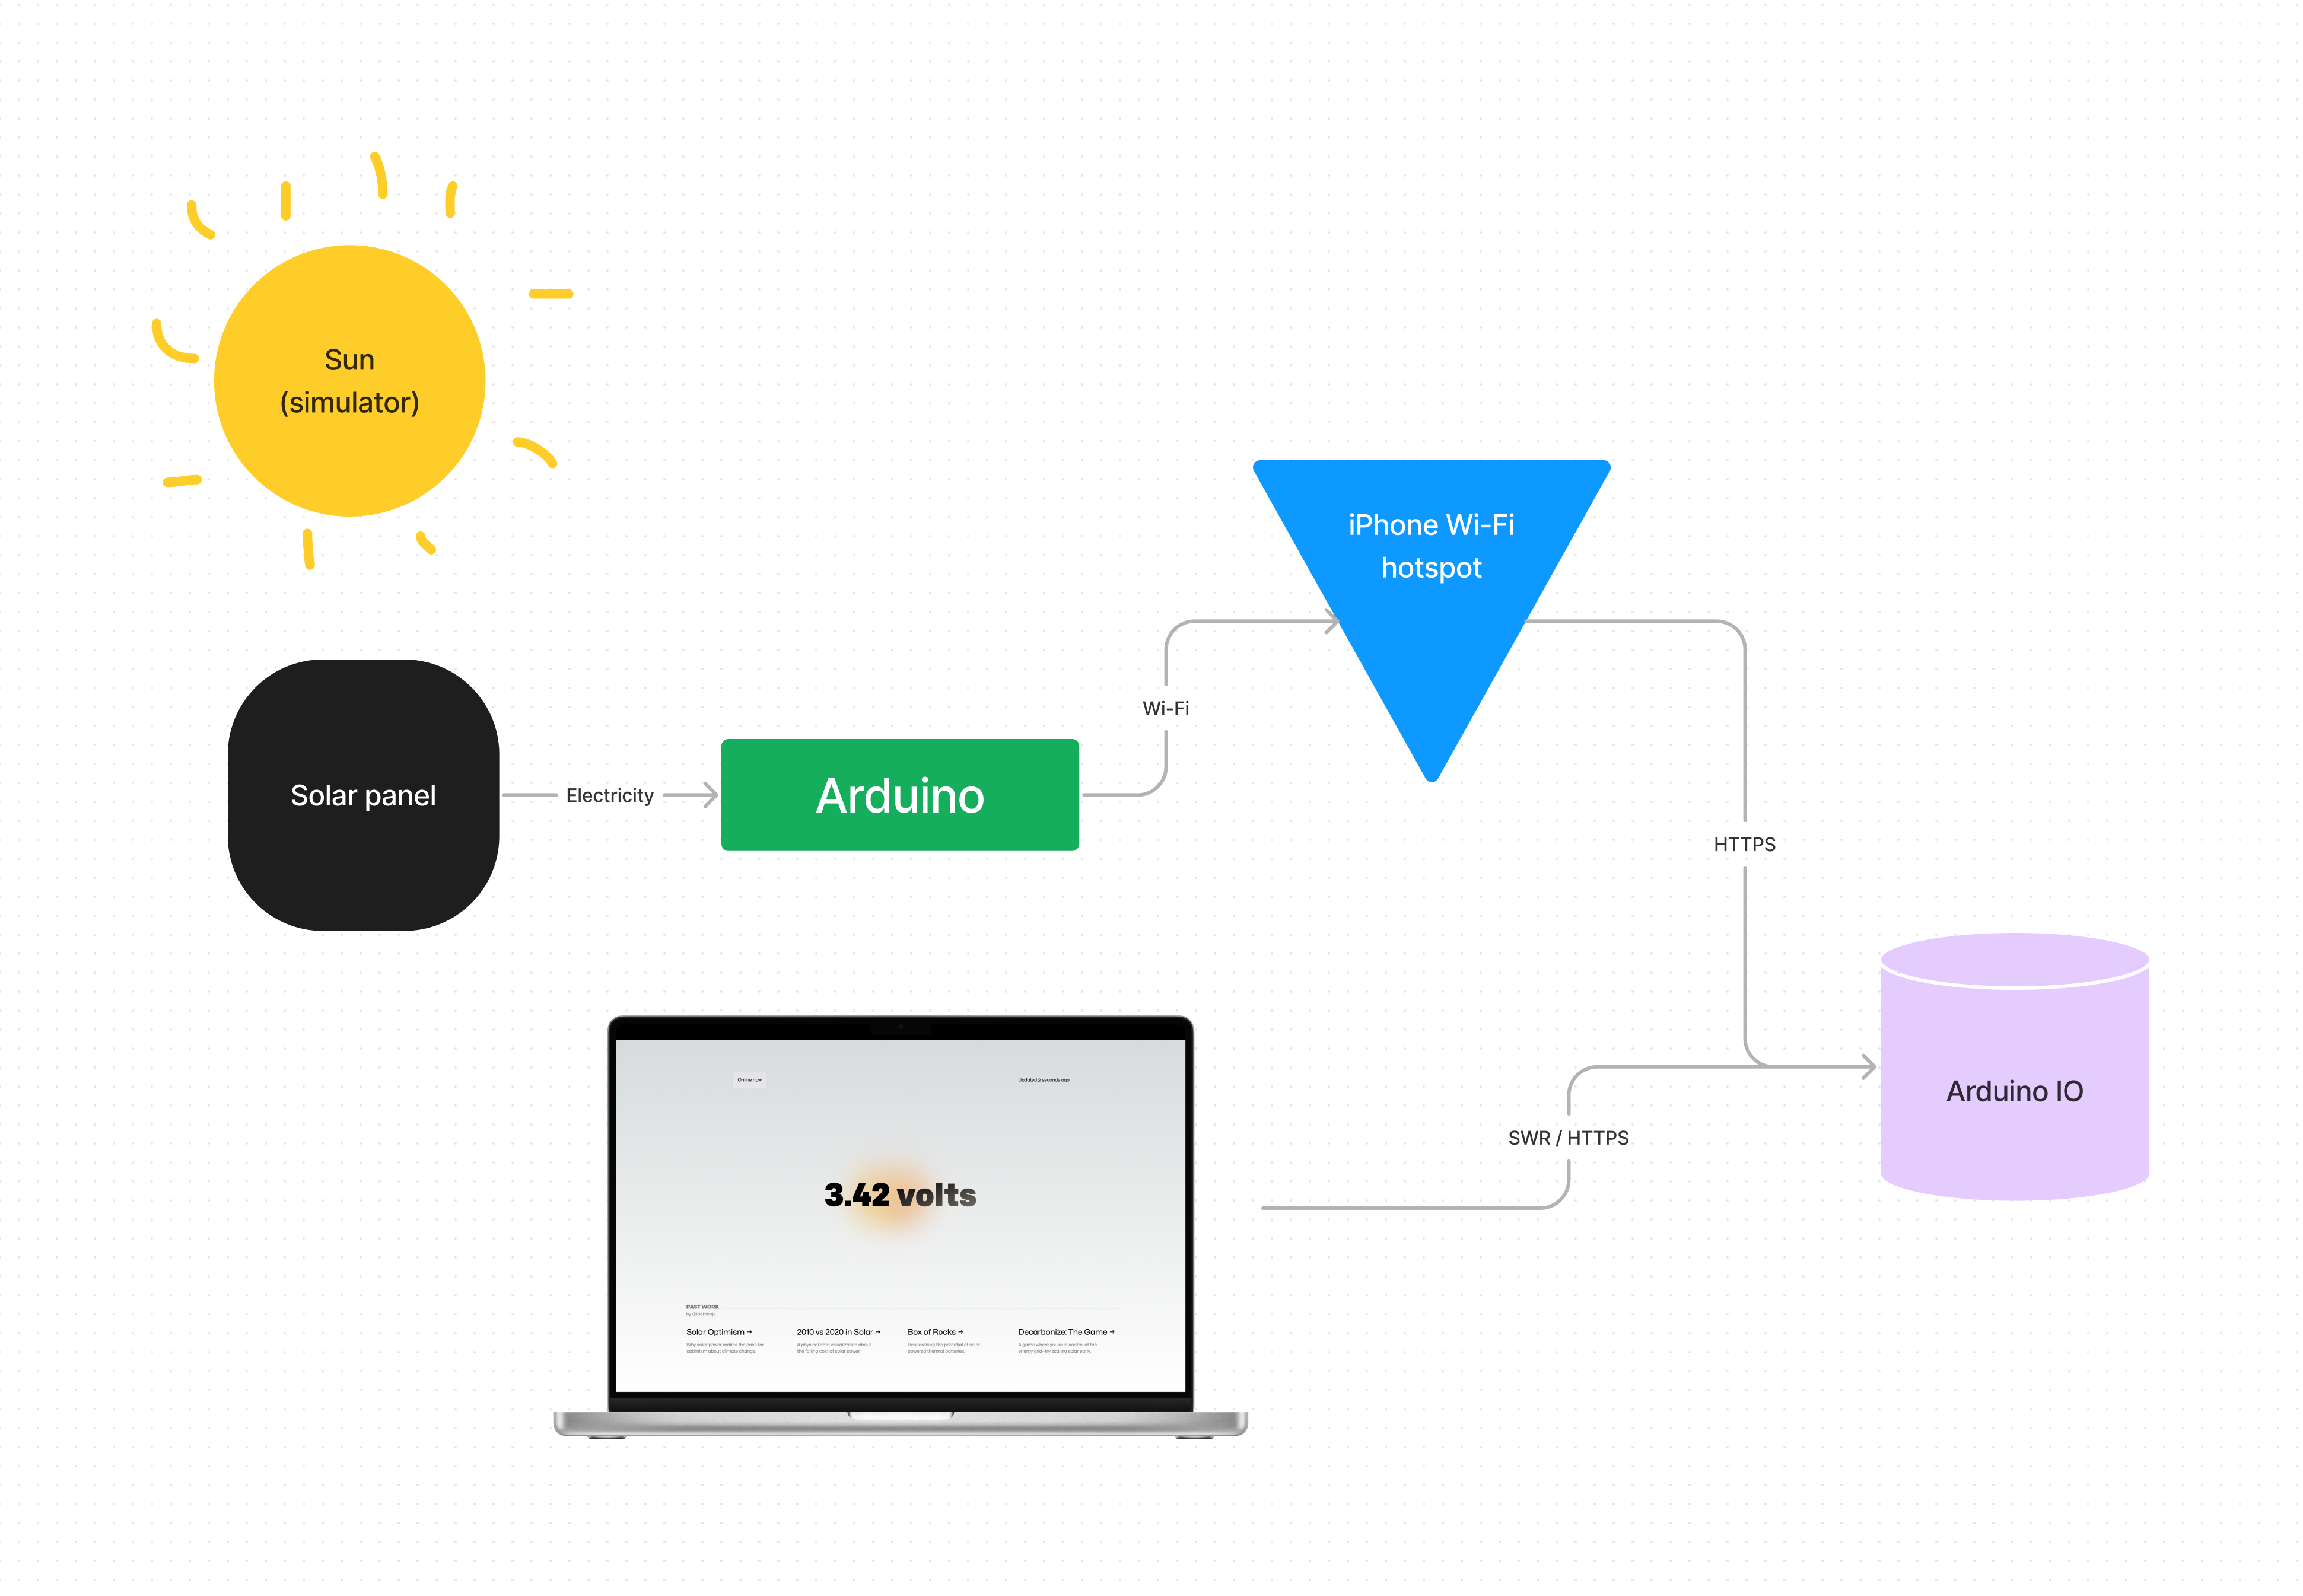
In the future, I’d love to make it more self-contained as a module with more personality—an enclosure using the solar panel as a roof with the electronics contained inside and an introduction and QR code on the other sides. It’s a friendly little monster, in my mind.