Week 4 – Photographic visualization project
Standing outside a boba shop with my roommate recently, I was accidentally blocking a nondescript door I hadn’t noticed existed. I remarked that “every door in NYC is used by someone.” Beyond that, the doors you use say a lot about your life: whether they’re fancy, glass, padlocked, service, formal, electronically-controlled. They reveal class, occupation, habits. For this project, I wanted to photograph doors I pass through in my NYU life.
Open projectAfter ruling out a few classes of door (like bathrooms, to avoid making anyone uncomfortable), & deciding to take photos upon entry but not exit, I started photographing. The hardest part of the whole project was…remembering to take the pictures, which I forgot to do plenty of times. The project would’ve been more interesting if I expanded it to non-NYU doors I went to, of stores & hangouts & subways around the city, but there was no automated solution to reminding me when I was about to enter a door.
Looking at the first few days of photos, my dorm door was clearly the most common door. I filtered the photos to exclusively that door, which I’d not tried to keep consistent. Playing with CSS filters at reduced opacity, I landed on mix-blend-mode: color-dodge; for layering them.
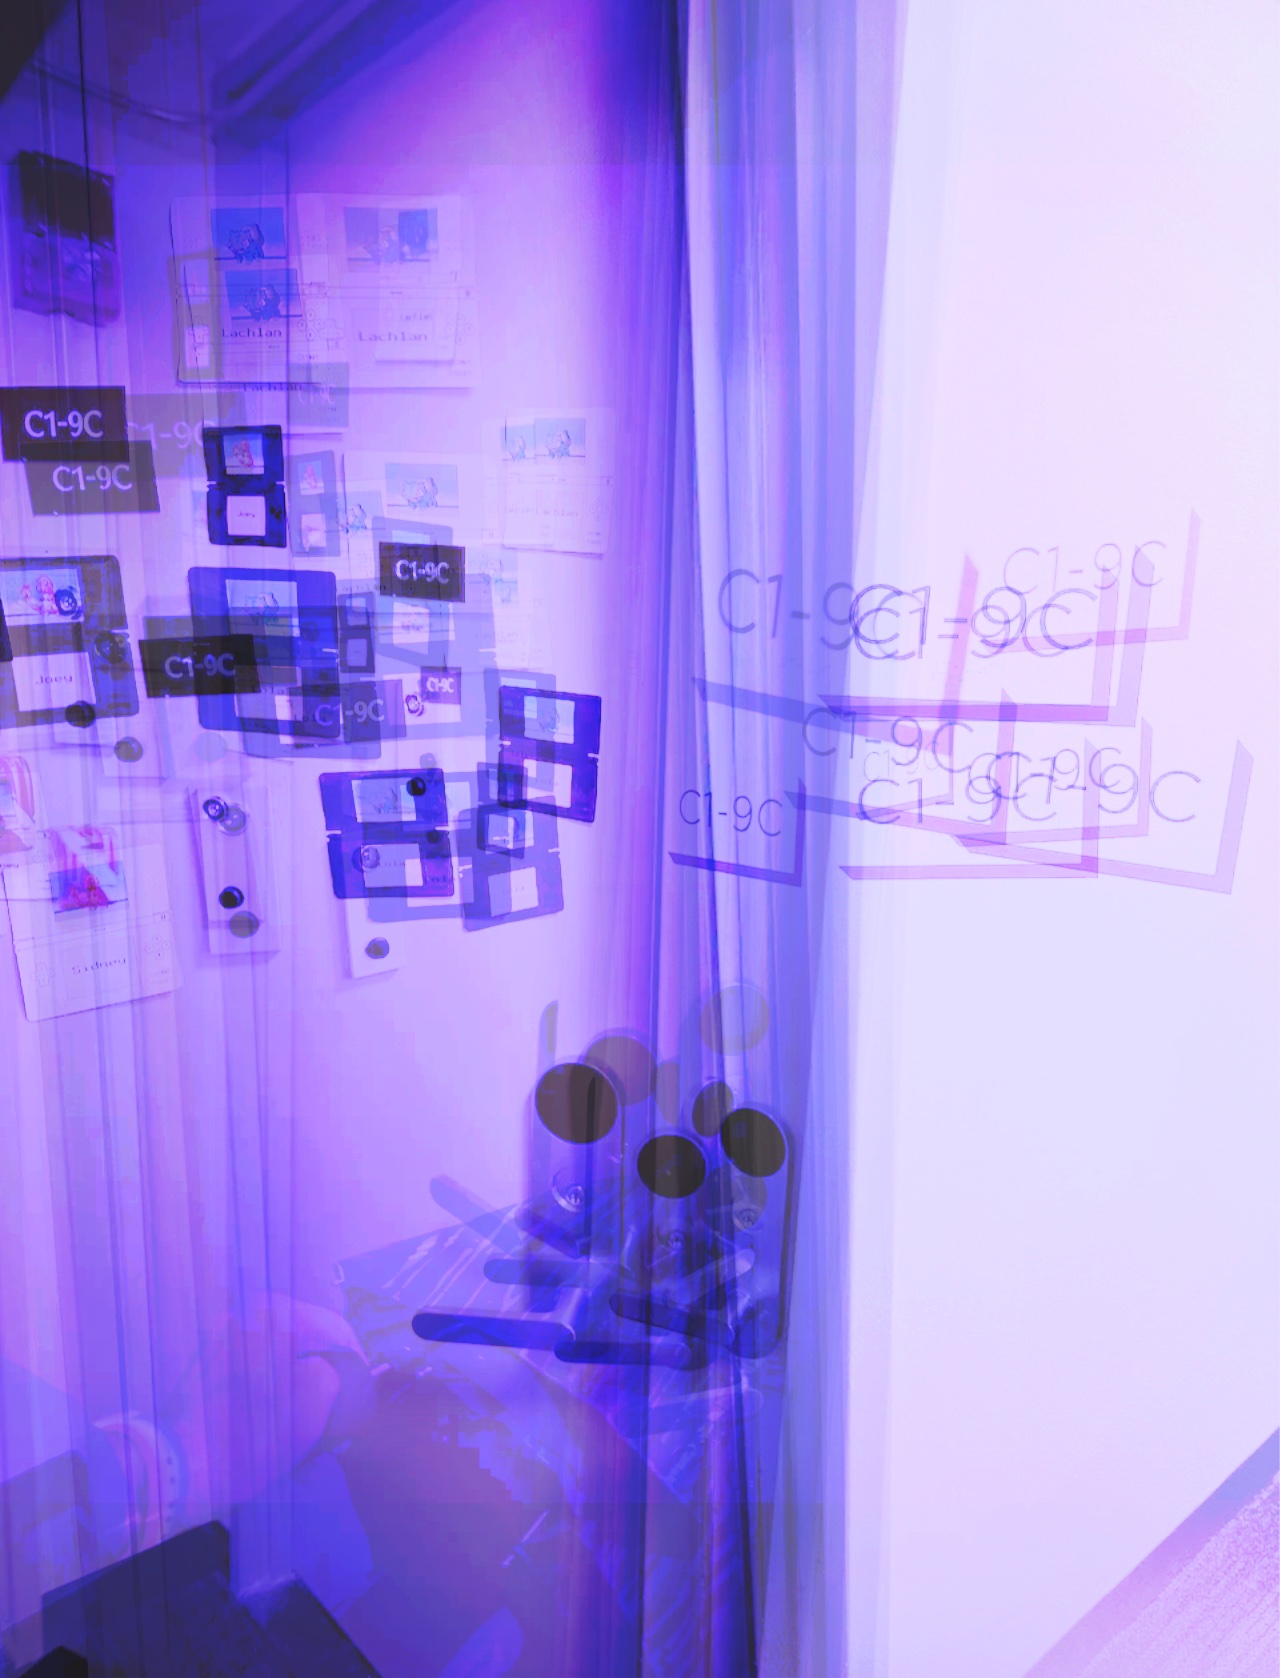
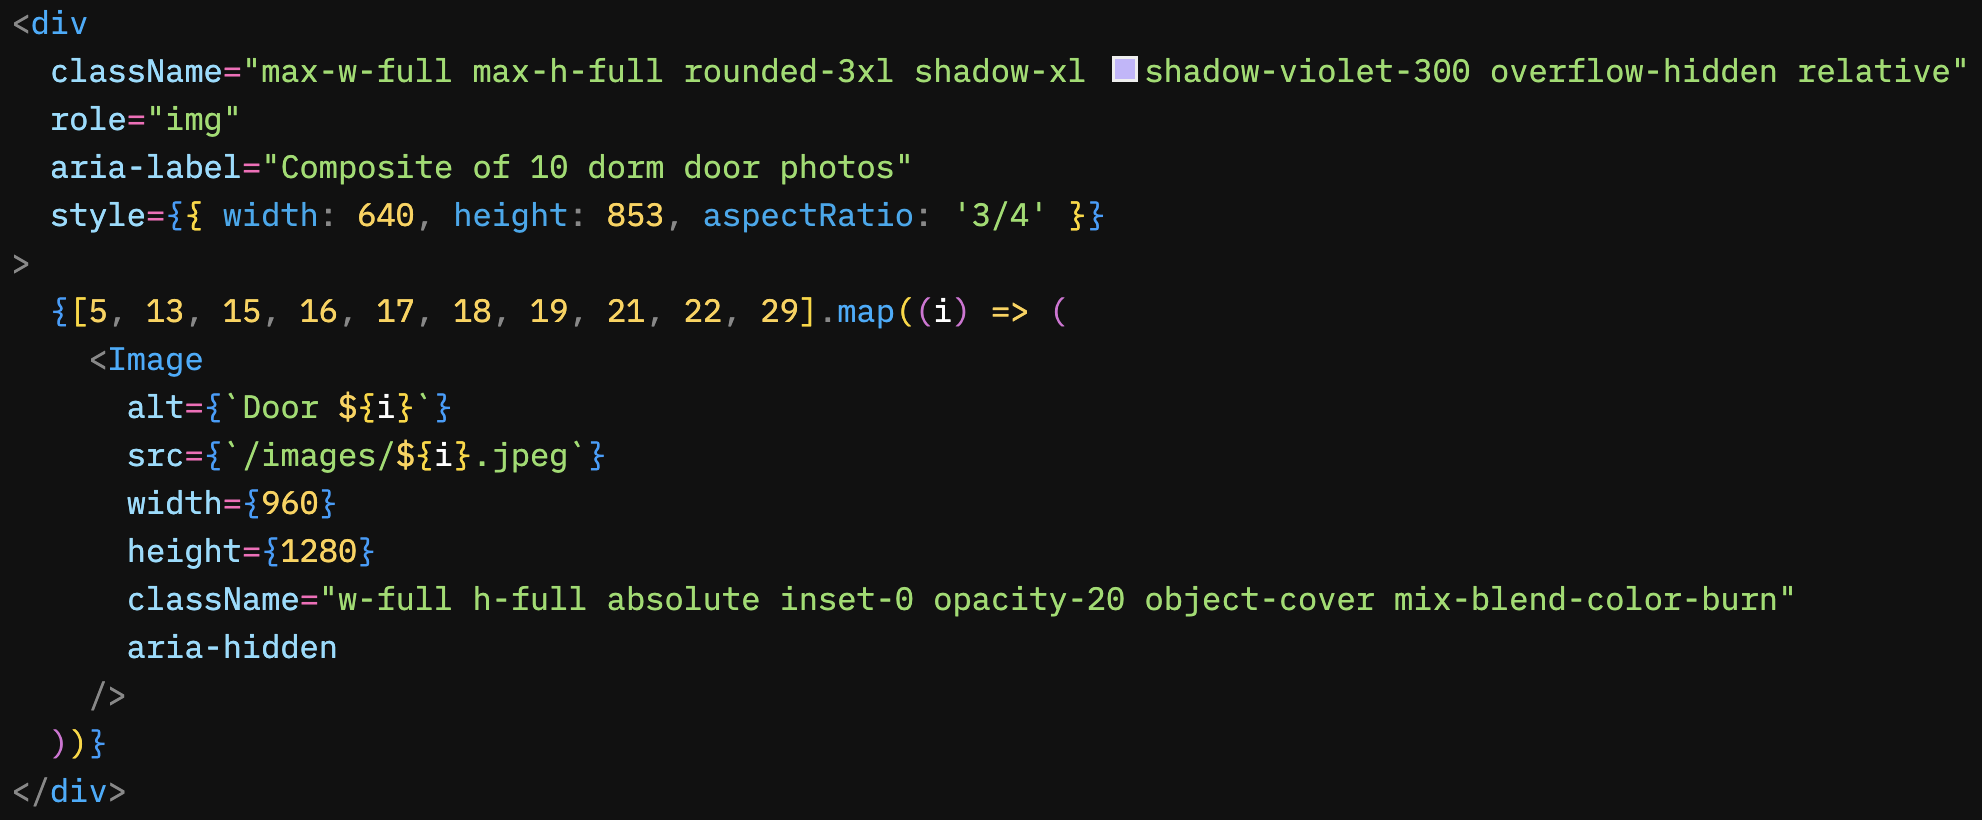
The effect is live in the browser, so requires no regeneration as I take more photos. The React/CSS for creating this visualization ended up more straightforward than I’d expect:
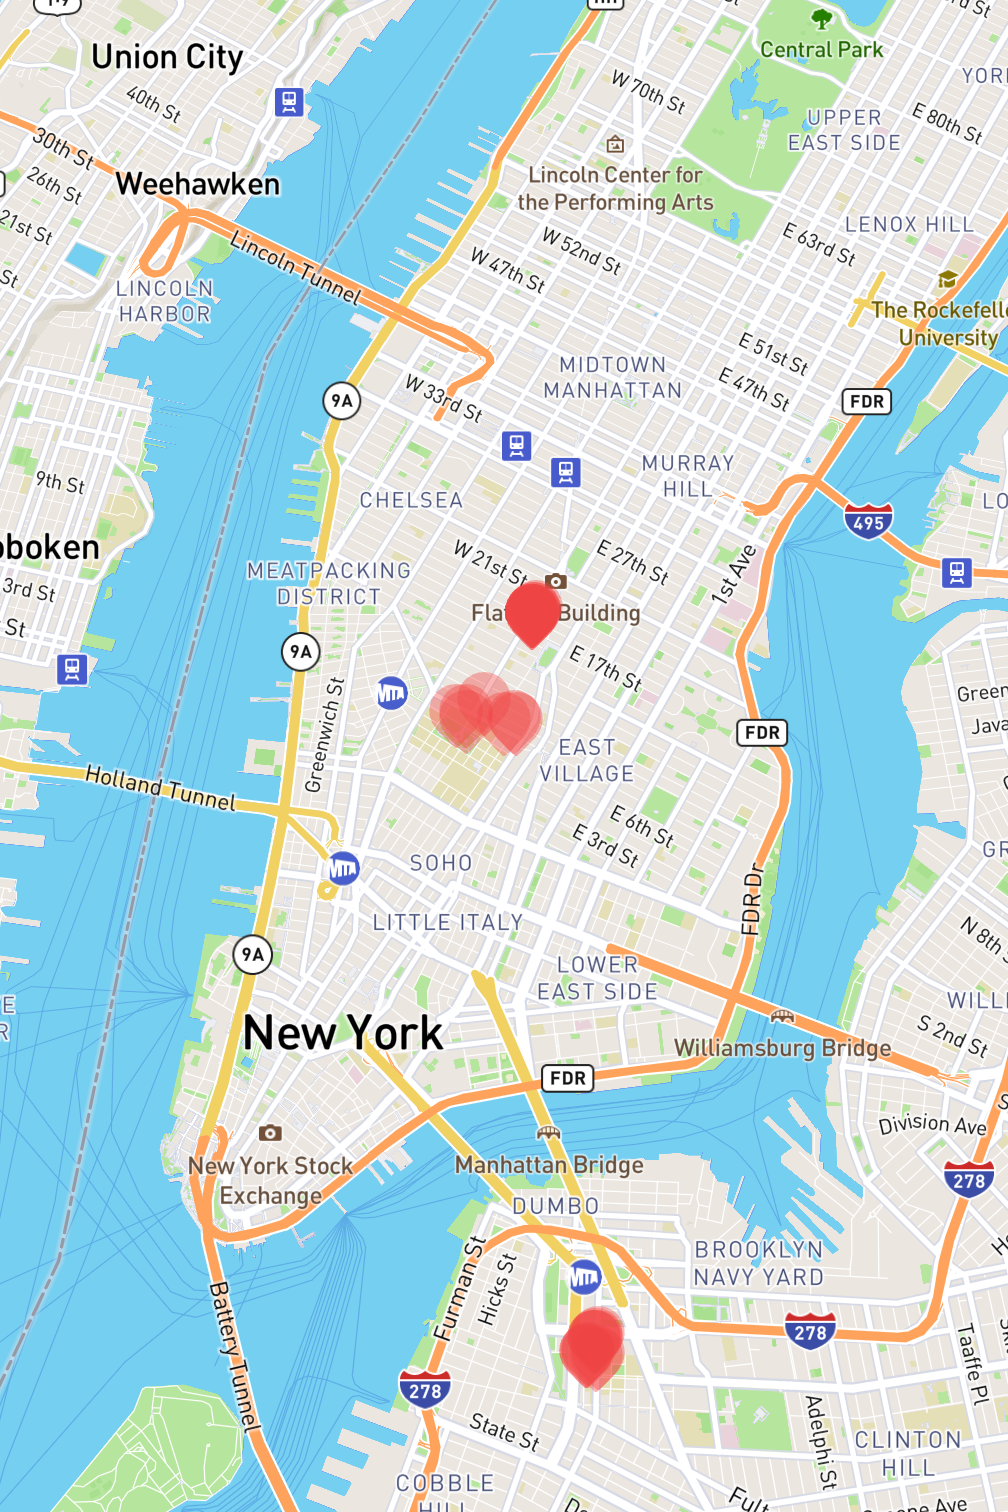
Conveniently, iPhone records time, latitude, & longitude on every photo (alongside a host of photographic metadata, such as the lens). Using a build script inside Next.js’s getStaticProps, I used the exifr npm package to programmatically read the lat/lng of each photo. This made it easy to plot a map of where each photo was taken, & lowering the opacity on the pins, it revealed the frequency with which I went to locations via a geographic color visualization.