Week 3 – Scrollytelling project
This week, I custom-coded a website telling the story of 51 deaths of migrants in San Antonio, TX from last summer.
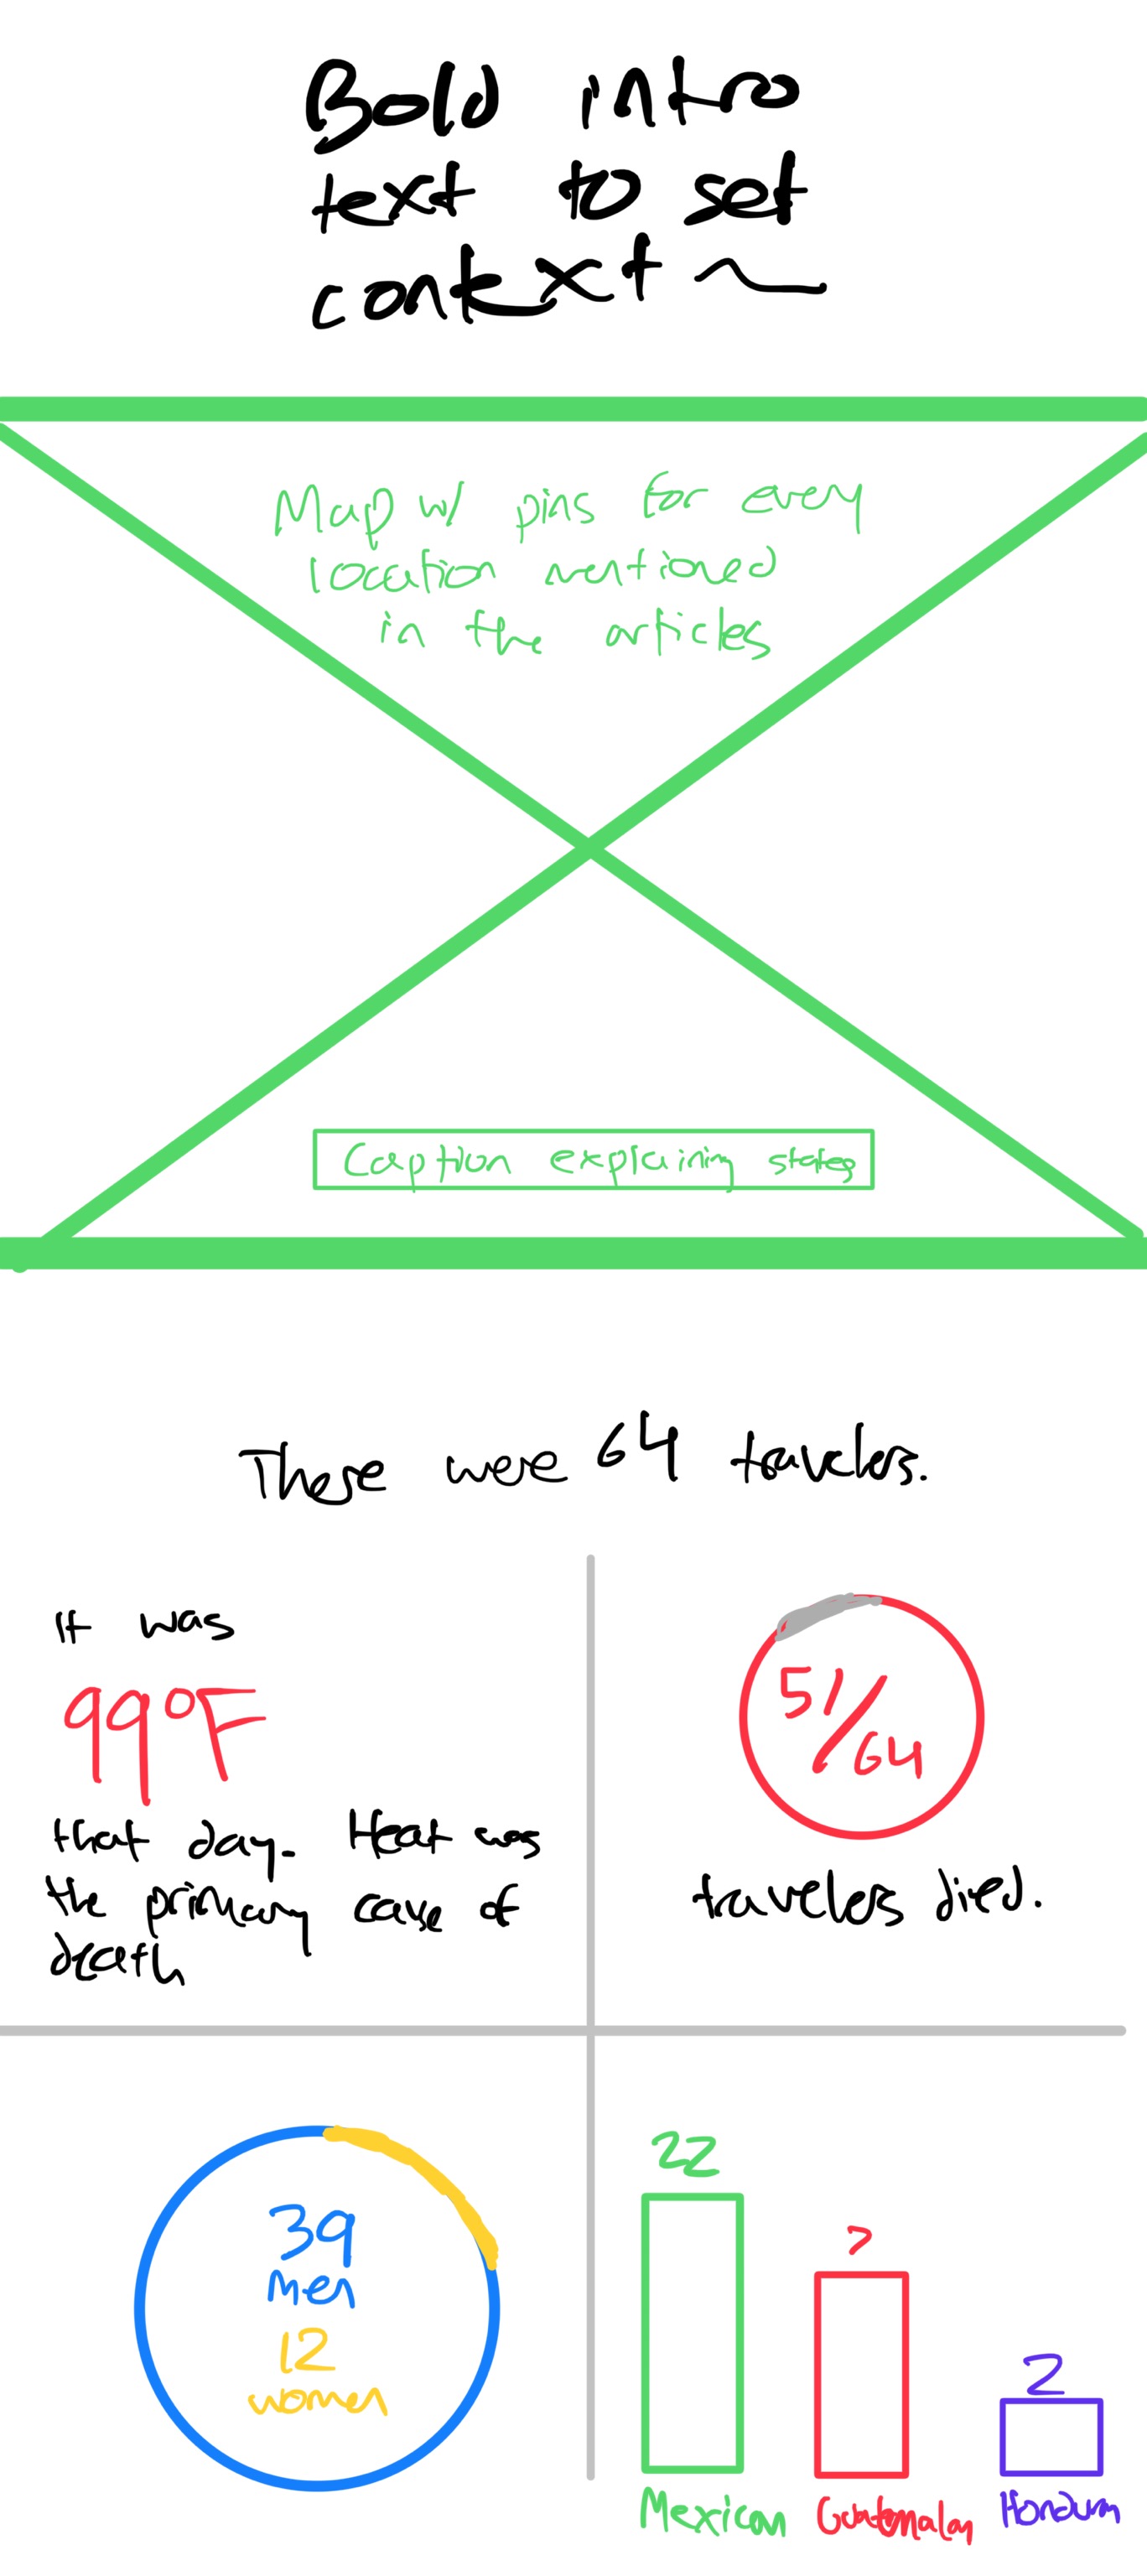
Open projectI knew that coding this site, especially while learning several new libraries, would mean spending more time per visualization at the expense of length I could achieve with a no-code GUI. Since the New York Times coverage didn’t include that many data points ripe for visualizing, I knew that the location would play a big part; personally, I’ve never been to Texas & don’t have a good sense of the geography, so I couldn’t follow the different town names mentioned in the articles. I wanted to animate a map of the truck’s progress to communicate the geography story.
Humanizing the victims of this story I knew would be challenging, since the New York Times coverage had so little information about who they were: we have a total count, death count, & an incomplete demographic breakdown. I came up with a few visualizations in my early storyboard, but felt they were incomplete.
Coding-wise, I started by using React with Next.js, a setup I’ve used hundreds of times, but I wanted to learn several new technologies through building this project. Tailwind CSS I’ve been aware of & played with occasionally in the past, but this was by far my most robust usage of it so far. Framer Motion is an animation library I’ve heard rave reviews of, but barely used prior. I started by adapting its scroll progress example for the progress bar & used its useInView hook to trigger the simple CSS transitions of animations in the last section. For the map, I used react-map-gl with tiles from Mapbox, which allowed the panning & zooming with smooth transitions between each state. For the charts, I made them with standard CSS; using a full charting library like D3 or Recharts felt like overkill.
I showed an earlier prototype of the project to friends on a FaceTime call for “user testing.” At that time, I had the animations on the map be time-based: every 5 seconds it would advance to the next stage of the map story, with reloading the page as the only option to view stages again. They both said they weren’t sure when the map would be finished animating, or how to interact with it.
Switching the map to scroll-linked animations took some testing & figuring out for me, since I’ve never built a fixed-position multi-screen scrolling animation like that. It’s not as complicated as I expected: you put a container around the map with a height of 5 screens, make the map 1 screen high but sticky position to the top of the viewport, then you measure scroll events happening inside the container in fifths to get which stage you should be in. Framer Motion’s target option in the useScroll hook provided much of this math for me, once I figured out the CSS. Experience-wise, I think it’s a huge improvement.
The code is open source on GitHub here.